
Dosya:Butterworth filter bode plot.png

Bu önizlemenin boyutu: 800 × 560 piksel. Diğer çözünürlükler: 320 × 224 piksel | 640 × 448 piksel | 1.024 × 717 piksel | 1.250 × 875 piksel.
Tam çözünürlük ((1.250 × 875 piksel, dosya boyutu: 110 KB, MIME tipi: image/png))
Bu dosya Wikimedia Commons'ta bulunmaktadır. Dosyanın açıklaması aşağıda gösterilmiştir. Commons, serbest/özgür telifli medya dosyalarının bulundurulduğu depodur. Siz de yardım edebilirsiniz. |
Özet
| Açıklama |
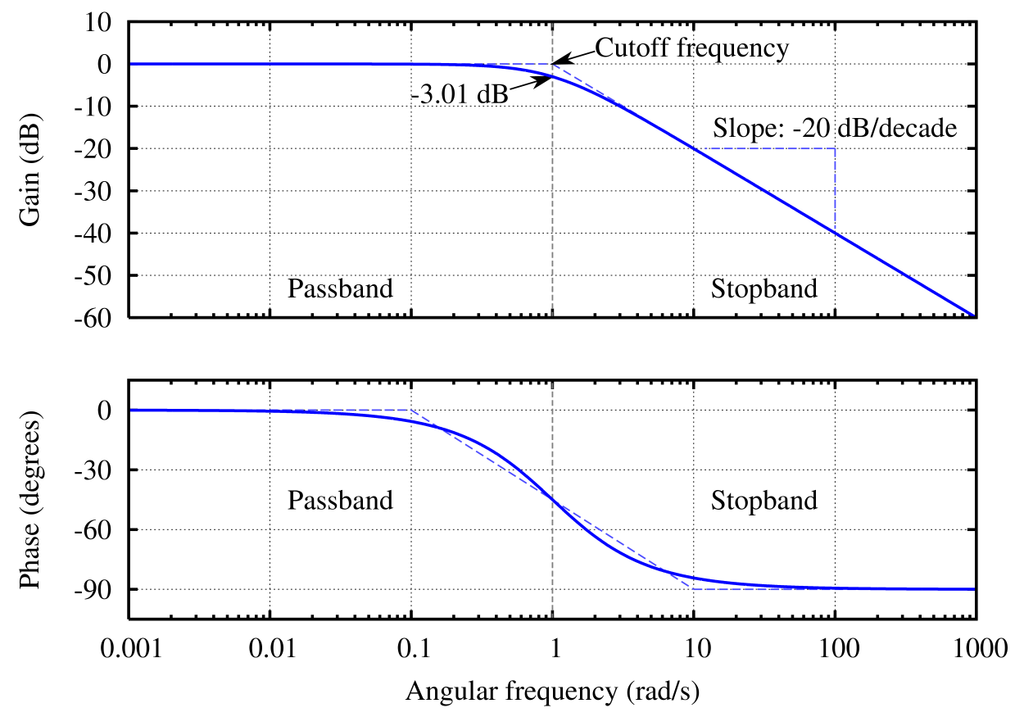
English: The Bode plot of a Butterworth filter with logarithmic axes and various labels. Cutoff frequency is normalized to 1 rad/s. Gain is normalized to 0 dB in the passband. Phase is in degrees because that's typical. The code is kind of kludgy, but makes a good output. See Wikipedia graph-making tips. Generated in gnuplot with the script below (save as butterworth_bode_plot.plt and then open in gnuplot). Then I opened the butterworth_bode_plot.ps file in a text editor to edit the line colors and linestyles, as per this description. This avoids needing to open in proprietary software, and really isn't that difficult (especially if you don't know the commands in the proprietary software either). ;-) Identify the lines easily by their color (the arrow is currently magenta and I want it to be black. Ah, there is the entry with 1 0 1, red + blue = magenta) or by using the gnuplot linestyle−1. (For instance, gnuplot's linestyle 3 corresponds to the ps file's /LT2.) Then you can edit the colors and dashes by hand. I changed the original: /LT0 { PL [] 1 0 0 DL } def
/LT1 { PL [4 dl 2 dl] 0 1 0 DL } def
/LT2 { PL [2 dl 3 dl] 0 0 1 DL } def
/LT3 { PL [1 dl 1.5 dl] 1 0 1 DL } def
into this: /LT0 { PL [] 0 0 1 DL } def
/LT1 { PL [4 dl 2 dl] 0.5 0.5 0.5 DL } def
/LT2 { PL [6 dl 3 dl] 0.3 0.3 1 DL } def
/LT3 { PL [] 0 0 0 DL } def
/LT4–/LT8 I left unchanged. (I don't know what they're used for anyway.) /LTw, /LTb, and /LTa are for the grid lines and such. To convert the PostScript file to PNG:
|
| Tarih | 8 Ekim 2005 (upload date) |
| Kaynak | Yükleyenin kendi çalışması |
| Yazar | Omegatron |
| Diğer sürümler |
[] .svg:
.png:
|
| gnuplot source | set samples 2001
set terminal postscript enhanced landscape color lw 2 "Times-Roman" 20
set output "butterworth bode plot.ps"
# Butterworth amplitude response and decibel calculation. n is the order, which is just 1 in this image.
G(w,n) = 1 / (sqrt(1 + w**(2*n)))
dB(x) = 20 * log10(abs(x))
# Phase is for first order
P(w) = -pi/2-atan(1.2*w)-atan(0.09*w)
# Gridlines
set grid
# Set x axis to logarithmic scale
set logscale x 10
# No need for a key
set nokey #0.1,-25
# Frequency response's line plotting style
set style line 1 lt 1 lw 2
# Asymptote lines and slope lines are the same "arrow" style
set style line 3 lt 3 lw 1
set style arrow 3 nohead ls 3
# -3 dB arrow style
set style line 4 lt 4 lw 1
set style arrow 4 head filled size screen 0.02,15,45 ls 4
# Separator between passband and stopband line style
set style line 2 lt 2 lw 1
set style arrow 2 nohead ls 2
set multiplot
# Magnitude response
# =============================================
set size 1,0.5
set origin 0,0.5
# Set range of x and y axes
set xrange [0.001:1000]
set yrange [-60:10]
# Create x-axis tic marks once per decade (every multiple of 10)
set xtics 10
#set ytics 10
# No need for two sets of numbers
set format x ""
# Use 10 x-axis minor divisions per major division
set mxtics 10
# Axis labels
set ylabel "Gain (dB)"
# Draw asymptote lines
set arrow 1 from 1,0 to 1000,-60 as 3
set arrow 2 from .001,0 to 1,0 as 3
# -3 dB arrow
set arrow 4 from 2,3 to 1,0 as 4
# "Cutoff frequency" label uses same coordinates as the function
set label 3 "Cutoff frequency" at 2,4 l
# "-3 dB" label
set arrow 5 from 0.5,-6 to 1,-3 as 4
set label 4 "-3.01 dB" at 0.5,-7 r
# Draw a separator between passband and stopband and label them
set arrow 3 from 1,-60 to 1,10 as 2
# Label coordinates are relative to the graph window, not to the function, centered at the 1/4 and 3/4 width points
set label 1 "Passband" at graph 0.25, graph 0.1 c
set label 2 "Stopband" at graph 0.75, graph 0.1 c
# Draw slope lines and label
set arrow 6 from 100,-20 to 12,-20 as 3
set arrow 7 from 100,-20 to 100,-39 as 3
set label 5 "Slope: -20 dB/decade" at 100,-15 c
plot dB(G(x,1)) ls 1 title "1st-order response"
#Phase response
# =============================================
set size 1,0.5
set origin 0,0
# Set range of x and y axes
set yrange [-105:15]
# Create y-axis tic marks every 15 degrees
set ytics 30
# Regular numbers
set format x "% g"
# Axis labels
set ylabel "Phase (degrees)"
set xlabel "Angular frequency (rad/s)"
# Draw asymptote lines
set arrow 1 from 0.1,0 to 10,-90 as 3
set arrow 2 from 0.001,0 to 0.1,0 as 3
set arrow 10 from 10,-90 to 1000,-90 as 3
# -3 dB arrow
unset arrow 4 #from 2,3 to 1,0 as 4
# "Cutoff frequency" label uses same coordinates as the function
unset label 3 #"Cutoff frequency" at 2,4 l
# "-3 dB" label
unset arrow 5 #from 0.5,-6 to 1,-3 as 4
unset label 4 #"-3.01 dB" at 0.5,-7 r
# Draw a separator between passband and stopband and label them
set arrow 3 from 1,-105 to 1,15 as 2
# Label coordinates are relative to the graph window, not to the function, centered at the 1/4 and 3/4 width points
set label 1 "Passband" at graph 0.25, graph 0.5 c
set label 2 "Stopband" at graph 0.75, graph 0.5 c
# Draw slope lines and label
unset arrow 6 #from 100,-20 to 12,-20 as 3
unset arrow 7 #from 100,-20 to 100,-39 as 3
unset label 5 #"Slope: -20 dB/decade" at 100,-18 c
plot P(x) ls 1 title "Phase response"
unset multiplot
|


|
File:Butterworth filter bode plot.svg, bu dosyanın vektör versiyonudur. Aşağı olmadığında bu raster görüntünün yerine kullanılmalıdır.
File:Butterworth filter bode plot.png → File:Butterworth filter bode plot.svg
Daha fazla bilgi için Help:SVG/tr sayfasına bakın. |
 |
Lisanslama
Ben, bu işin telif sahibi, burada işi aşağıdaki lisanslar altında yayımlıyorum:
Bu dosya Creative Commons Atıf-Benzer Paylaşım 3.0 Aktarılmamış, 2.5 Genel, 2.0 Genel ve 1.0 Genel lisansları ile lisanslanmıştır.
- Şu seçeneklerde özgürsünüz:
- paylaşım – eser paylaşımı, dağıtımı ve iletimi
- içeriği değiştirip uyarlama – eser adaptasyonu
- Aşağıdaki koşullar geçerli olacaktır:
- atıf – Esere yazar veya lisans sahibi tarafından belirtilen (ancak sizi ya da eseri kullanımınızı desteklediklerini ileri sürmeyecek bir) şekilde atıfta bulunmalısınız.
- benzer paylaşım – Maddeyi yeniden düzenler, dönüştürür veya inşa ederseniz, katkılarınızı özgünüyle aynı veya uyumlu lisans altında dağıtmanız gerekir.

|
Bu belgenin GNU Özgür Belgeleme Lisansı, Sürüm 1.2 veya Özgür Yazılım Vakfı tarafından yayımlanan sonraki herhangi bir sürüm şartları altında bu belgenin kopyalanması, dağıtılması ve/veya değiştirilmesi için izin verilmiştir;
Değişmeyen Bölümler, Ön Kapak Metinleri ve Arka Kapak Metinleri yoktur. Lisansın bir kopyası GNU Özgür Belgeleme Lisansı sayfasında yer almaktadır. |
İstediğiniz lisansı seçebilirsiniz.
Dosya geçmişi
Dosyanın herhangi bir zamandaki hâli için ilgili tarih/saat kısmına tıklayın.
| Tarih/Saat | Küçük resim | Boyutlar | Kullanıcı | Yorum | |
|---|---|---|---|---|---|
| güncel | 20.01, 8 Ekim 2005 | | 1.250 × 875 (110 KB) | Omegatron | last revision? |
| 19.41, 8 Ekim 2005 |  | 1.250 × 875 (113 KB) | Omegatron | better | |
| 19.30, 8 Ekim 2005 |  | 1.250 × 875 (117 KB) | Omegatron | The frequency response of a Butterworth filter with logarithmic axes (Bode plot) and various labels. Cutoff frequency is normalized to 1 rad/s. Gain is |
Dosya kullanımı
Bu görüntü dosyasına bağlanan sayfa yok.
Küresel dosya kullanımı
Aşağıdaki diğer vikiler bu dosyayı kullanmaktadır:
- eo.wikipedia.org üzerinde kullanımı
- eu.wikipedia.org üzerinde kullanımı
- fr.wikipedia.org üzerinde kullanımı
- he.wikipedia.org üzerinde kullanımı
- hi.wikipedia.org üzerinde kullanımı
- hu.wikipedia.org üzerinde kullanımı
- nn.wikipedia.org üzerinde kullanımı
- pl.wikipedia.org üzerinde kullanımı
- pt.wikipedia.org üzerinde kullanımı
- zh.wikipedia.org üzerinde kullanımı